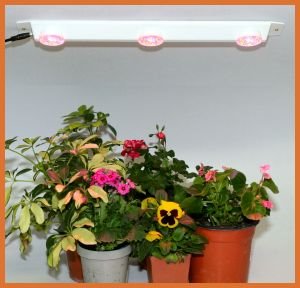
Unlike LED Lights, Artificial light sources are usually evaluated based on their lumen output. Lumen is a measure of flux, or how much light energy a light source emits (per unit time). The lumen measure does not include all the energy the source emits, but just the energy with wavelengths capable of affecting the human eye. Thus the lumen measure is defined in such a way as to be weighted by the (bright-adapted) human eye spectral sensitivity. If we plot this sensitivity as a function of the wavelength of the light (building the so called photopic curve), we see that it has an approximately bell shape, peaking up at a wavelength of around 550 nanometers (nm), the "green" region of the light spectrum, and decreasing at both longer (red) and shorter (blue) wavelengths. See the plot here. The consequence is that two light sources that emit the same total amount of energy can have vastly different lumen ratings, depending on how much of that energy is concentrated around the 550 nm region.
Another quantity often quoted when talking about light output is lux. Lux is a measure of illumination, not flux. Flux refers to the light energy that leaves the source. Illumination refers to the light energy that reaches the receiving surface. Lux is equivalent to lumens/m2. Lux cannot be computed only from the know data of a light source. Additional information regarding the illumination geometry, reflectors, distances, intervening media (glass covers, etc.) must be taken into account.
Other quantities used to describe light quality associated with its visual characteristics are color temperature and color rendering index (CRI). Color temperature is defined as the temperature that a perfect electromagnetic radiator ("black body") would have to have to emit light with the same "color" as the light source in question. Higher color temperature means bluer color, lower temperature, redder color. Color temperature is expressed in degrees Kelvin (from Lord Kelvin, the 19th century physicist, and which means degrees Celsius above absolute zero). CRI measures how close to their "true color" a light source can render objects illuminated by it. A "perfect" light source would have a CRI of 100, lower values mean that the colors are shifted from their "true" hue and saturation. Many people are familiar with the color shifting that takes place when one buys clothes in a store with artificial illumination and then realizes that under natural (sun) light the colors are not quite the same. Had the store used high-CRI light bulbs that color shift would be much smaller or not noticeable at all.
It is easy to guess from the wording in the above paragraph that these two parameters are also strongly related to the human eye response characteristics. In fact, the technical definition of the term "color" used above is directly based on psychophysics experiments performed with human subjects and standardized by the CIE (Commission Internationale d'Eclairage) about 60 years ago. In other words, color temperature and CRI are parameters entirely based on the human visual system characteristics and may carry absolutely no meaning when applied in other contexts.
Laboratory experiments showed that the photosynthesis process that takes place in plants when submitted to intense light has a very different spectral response than the human eye. In fact, photosynthesis is the least efficient in the region around 550 nm. Most of the light capable of inducing the photosynthesis reaction is either red or blue. In other words, plant leaves mostly reflect green light, while they absorb red and blue with higher efficiency. An experimental fact that confirms this statement, independent of any laboratory measurement, is the fact that many plants look green ! Portable field instruments used to quantify photosynthesis in growing plants often exploit this fact by using as light source a pair of red and blue LEDs (Light Emitting Diode) instead of a white light source.
The curve that results from plotting photosynthesis efficiency as a function of wavelength is named "Photosynthesis Action spectrum". It is the equivalent of the photopic curve for photosynthesis. The curve is typically double-peaked, with peaks around 420 nm (blue) and 670 nm (red) and a "valley" around 550 nm. The curve drops sharply below 400 nm and above 700 nm. The peaks are broad and not as pronounced as the central peak in the photopic curve. There is still significant response in the green region around 550 nm. See a typical curve here. Many plant species can show specific action spectra that differ markedly from that "average" curve. In some extreme cases there is no response at all in one of either red or blue regions. The important point is that photosynthesis has a much broader wavelength response than the human eye, with less dependency on specific, narrow wavelength regions. Thus, light sources that look very different to us may "look" similar to a plant. Conversely, light sources that look similar to us may "look" very different to plants, all depending on their specific spectral distributions.
In some instances we see references to "plant growth spectrum" as well. This is not to be taken as equivalent to the action spectrum though. The action spectrum has a precise meaning in terms of quantity (in moles/sec/leaf surface area) of CO2 consumed by the plant subject to measurement. "Growth", on the other hand, can be defined in many different ways (height ? weight ? weight of dry plant mass ?) that can be even very species-dependent, so it hardly makes a good standard for comparison purposes.
Based on the Photosynthesis Action Spectrum, light bulb manufacturers came up with fluorescent "plant bulbs". They basically emit most of their light in the wavelengths that are more efficient for photosynthesis, namely the red and blue ends of the visible spectrum. As expected, these light sources look dim to the human eye and consequently have poor lumen ratings. Also, their color temperature and CRI ratings have little, if any, meaning. After all, these bulbs were not designed to be "seen" by humans...
The standard measure that quantifies the energy available for photosynthesis is "Photosynthetically active radiation" (aka "Photosynthetic Available Radiation") or PAR. Contrary to the lumen measure that takes into account the human eye response, PAR is an unweighted measure. It accounts with equal weight for all the output a light source emits in the wavelength range between 400 and 700 nm. PAR also differs from the lumen in the fact that it is not a direct measure of energy. It is expressed in "number of photons per second", whose relationship with "energy per second" (power) is intermediated by the spectral curve of the light source. One cannot be directly converted into the other without the spectral curve.
The reason for expressing PAR in number of photons instead of energy units is that the photosynthesis reaction takes place when a photon is absorbed by the plant, no matter what the photon's wavelength (or energy) is (provided it lies in the range between 400 and 700 nm). That is, if a given number of blue photons is absorbed by a plant, the amount of photosynthesis that takes place is exactly the same as when the same number of red photons is absorbed. For convenience, number of photons is usually reported in the literature in micromole units, or microEinsteins. One microEinstein is equivalent to 6.02 1017 photons. Another important difference is that usually PAR is quoted as an illumination measure akin to lux, thus related to the receiving surface. PAR is typically reported in microEinstein/second/m2.
Thus we see from the above that, to evaluate
Solid State Lighting sources (Led Grow Lights) for use in plant applications, we cannot in principle rely entirely on an human-based criterion, the lumen rating. Unfortunately, most if not all manufacturers provide little information in that regard. Power consumption in Watts and lumen ratings are easy to get, and for many bulbs spectral plots do exist. Many of these are not depicted in physically meaningful units though (such as Watt/nanometer), making it difficult to compare different products. PAR figures are never quoted because they depend on the detailed illumination geometry, which varies from setup to setup. The Solid State lighting industry is just now starting to standardize LED measurements and reporting which will go a long way in helping to shape the emerging market for LED Grow Lights.
Action spectrum
